
Dashboard
The Dashboard is the Erebros home screen, at /.
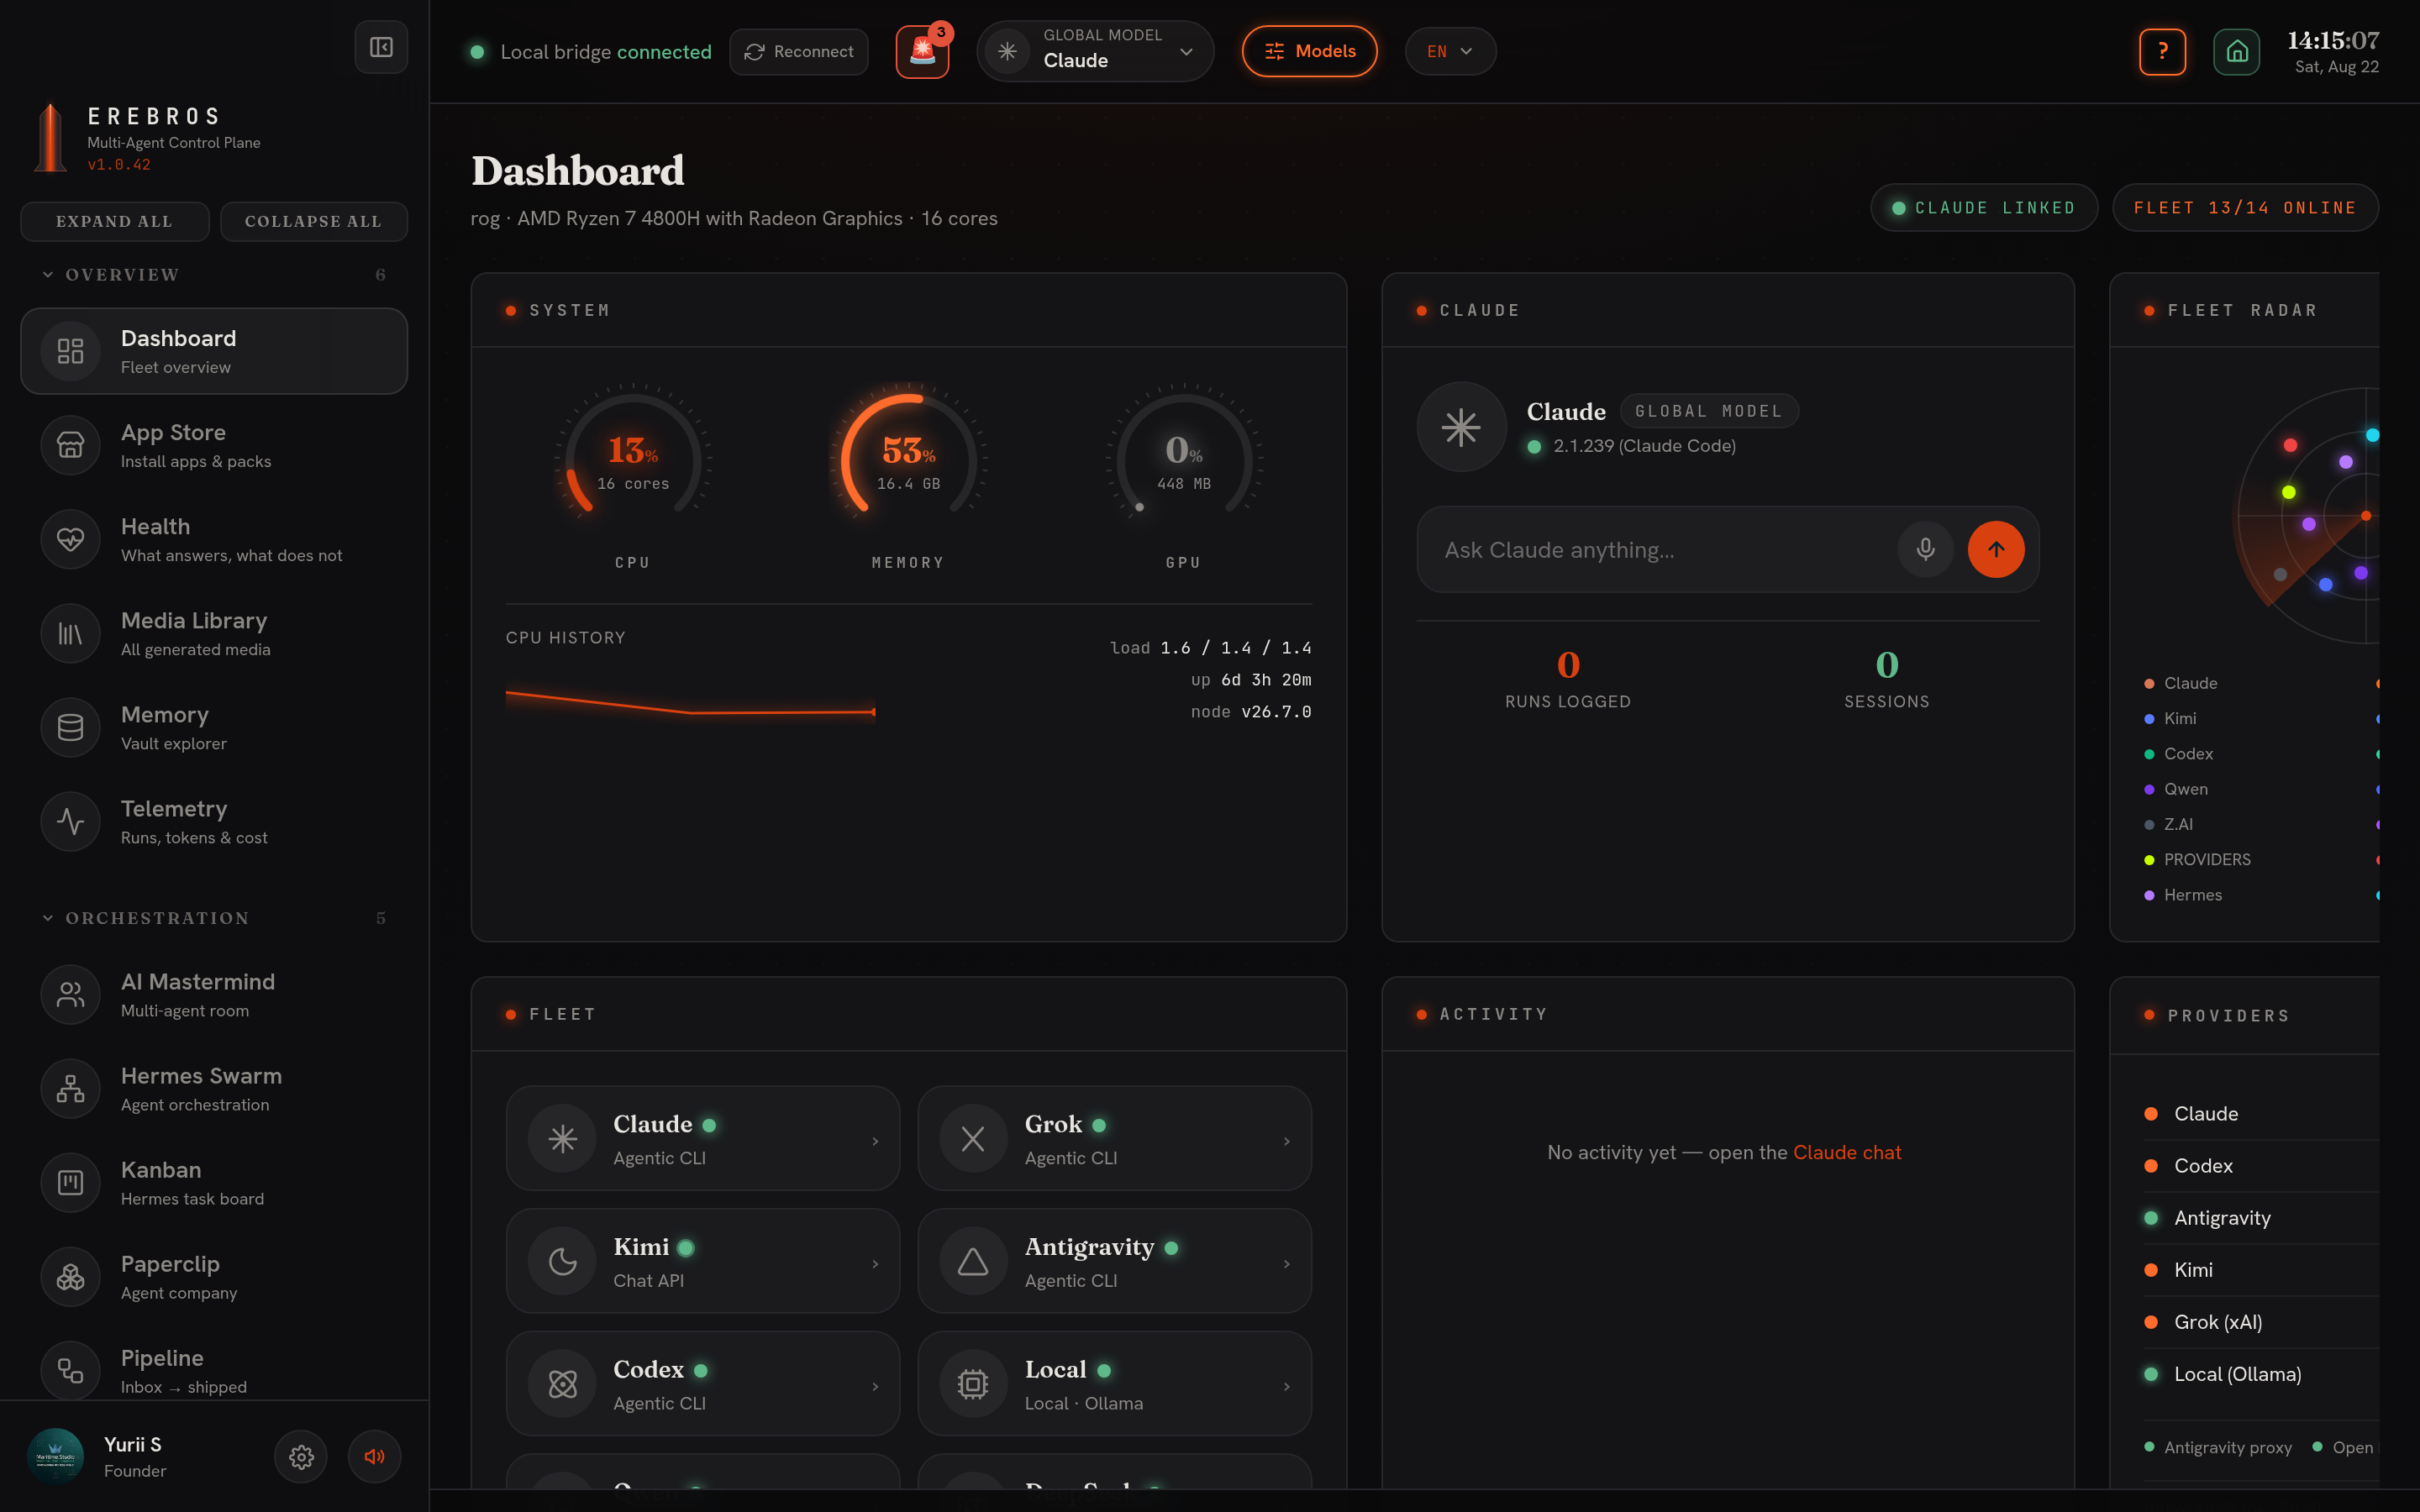
What it does
Section titled “What it does”Shows the whole fleet at a glance: CPU/RAM gauges with a sparkline, a Fleet radar, and a card for every model and agent in the sidebar (online/offline, respecting your Settings show/hide). It also carries an activity feed, Goals & Journal capture, and a live preview of today’s vault note. Start here to see what is online.
Key panels
Section titled “Key panels”- System gauges, CPU and RAM, with a sparkline of recent load.
- Fleet radar, a visual read on which models and agents are reachable.
- Model and agent cards, one per sidebar entry, showing online/offline state; hidden entries from Settings are omitted.
- Quick-ask panel, the featured panel follows the global model. Change the model in the top bar and the panel (and where your question is sent) switches instantly.
- Providers panel, shows which model backends are up / down / unknown, including the background Antigravity proxy daemon. It flags when Erebros has failed over to a backup model, and shows an estimated spend today with an optional daily-budget alert.
- Activity feed, recent events across the platform.
- Goals & Journal, capture goals and journal entries; they append to your vault.
- Today’s vault note, a live preview of the current day’s markdown note.
Updates
Section titled “Updates”When a newer release exists, an update bar appears at the top of the Dashboard with the new version, how far behind you are, and an expandable changelog. The same information is available any time under Settings → Updates.
None. The Dashboard runs with no configuration.
- Set a daily-budget alert in the Providers panel to be warned when estimated spend crosses a threshold.
- Use the quick-ask panel to route a fast question at the current global model without leaving the home screen.